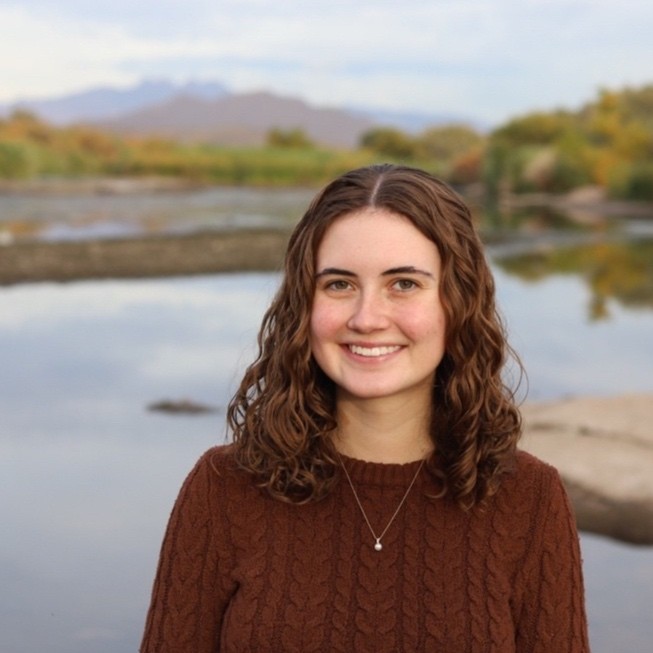
Samantha E. Rasmussen's Headshot

Hey, I'm Sam :)

 A data analyst, AI enthusiast, and creative problem solver. I'm currently on a mission to turn curiosity into code, data into insight, and ideas into things that actually help people. This is my little slice of the internet. I explore data, build cool things, and occasionally overthink my color palettes.
‍
Whether you're here to check out projects, learn more about what I do, or just passing through, welcome.
‍
And yes, the resume is linked (because I’m nothing if not organized).

If this website somehow ends up floating in a digital time capsule a hundred years from now, I hope it says this: I cared about people, technology, and the intersection where they meet.

Right now, I’m a Senior Independent Testing Specialist on the AI Optimization Team within Corporate Risk at Wells Fargo. I work on the fun kind of complicated problems, using AI, automation, and analytics to make highly regulated processes smarter and easier to trust. Recently, that has included building an AI prompt classification pipeline, creating Power BI dashboards monitoring regulatory compliance, leading the data strategy for pilot engagements, and helping shape tools that let non-technical users query data through natural language. Most days involve Power BI dashboards, SQL scripts, Python notebooks, and a very well-organized digital workspace.

While at Indiana University, I explored a mix of research and industry work that helped shape how I think about problem-solving. I worked on projects focused on healthcare access and animal-computer interaction, including building a drone system to support enrichment for animals in captivity and studying transportation equity in underserved communities (turns out tech for good can look like a flying robot helping an orangutan stay curious). Around the same time, I interned at PwC on their Healthcare Transformation team, where I developed data workflows and dashboard prototypes to help make complex health systems more navigable. These experiences deepened my interest in inclusive design and thoughtful analytics, especially when real people rely on the outcomes.

I also spent a few years working with IU’s Center of Excellence for Women & Technology, where I created coding curriculum and led events that brought new learners into tech. I hosted full-day Python workshops, ran a fall coding camp at the Boys & Girls Club, and helped plan events for students at IU. More recently, I brought that same energy to Statistics Without Borders, where I co-developed and taught a data science workshop for faculty and graduate students at Obafemi Awolowo University in Nigeria. The setting and subject matter may have changed, but the goal stayed the same: creating a space where people can try, fail, ask questions, and keep learning anyway.

Whether I’m building a dashboard, writing curriculum, or googling the same error 20 times in a row, I’m happiest when I’m making things that help people. Especially if I get to color-code along the way.

And while I wouldn’t call myself a creative genius (yet), I do believe in good design, clean data, and the power of thoughtful solutions.

Personal Dining Dashboard

Personal Project | Tableau Dashboard
Inspired by the Beli app, I created and collected my own dataset to track where, what, and how I eat. The dashboard includes custom KPIs, medal-based rankings for top meals, category icons, and detailed notes for each experience. It reflects both a personal obsession with documenting food and a technical deep-dive into Tableau’s design capabilities. This project allowed me to combine data storytelling with user-focused design!
‍
View the dashboard
‍

VANISHING RAINFORESTS DASHBOARD

Personal Project | Tableau + Python + Geospatial Analysis
‍
This interactive dashboard explores how tropical rainforest loss intersects with biodiversity, zooming in on Costa Rica as a case study. Using Python (pandas, geopandas), Tableau, and data from Global Forest Watch and GBIF, I analyzed 20+ years of tree cover loss and species richness patterns. The dashboard includes custom maps, biodiversity overlays, and global comparisons, supported by data storytelling and original visual design.
‍
View the dashboard
Download the Static Infographic (PNG)
View the Python Jupyter Notebook (PDF)

Publications

Trust, reciprocity, and the role of timebanks as intermediaries: Design implications for addressing healthcare transportation barriers

Purpose:
Explores how community-based timebanking models can reduce healthcare access barriers through reciprocal service exchanges.
‍
Published At:
CHI 2022 – ACM Conference on Human Factors in Computing Systems
‍
‍Role: Performed qualitative analysis and contributed to interface prototyping.

Read the paper


‍

‍
‍

‍Payload drones and ACI: Drone navigation system prototype

Purpose:
Conceptual drone interface for animal-focused and humanitarian applications.

‍Published At: ACI 2022 – Animal-Computer Interaction Conference‍

‍Role: Designed the interface and prototyped the drone interaction system.
‍
Read the paper


‍

‍
‍